Extremely thin plates of bainitic ferrite can now routinely be induced in steels by heat–treatment at low homologous temperatures. Given the atomic mechanism by which the transformation occurs, morphology should be dominated by the minimisation of strain energy due to the displacements necessary to accomplish the change in crystal structure when austenite decomposes into bainite. Experiments have been conducted using atomic force microscopy in an attempt to characterise these displacements, with a surprising outcome that the shear strain is much larger than associated with conventional, coarser bainitic structures. It appears that this might explain why the plates of bainitic ferrite tend to be slender in this new class of nanostructured alloys.
Novel steels containing high concentrations of carbon and silicon have been developed by Caballero et al. [1–3] and the international activity in this developing field has recently been reviewed [4]; the most recent publication is by Hu and co–workers [5]. The steels are a development of carbide–free bainitic alloys, in which silicon is used to suppress the precipitation of cementite from the residual austenite during the course of the bainite transformation [6, 7]. A most significant feature of the alloy design is that the bainite is able to form at unconventionally low temperatures resulting in a structure of incredibly fine plates of bainitic ferrite in a matrix of carbon enriched retained austenite, resulting in a dramatic increase in hardness and strength while at the same time achieving reasonable fracture toughness and ductility. The material is now commercially available [8] and the manufacturing process has been established to a point where many hundreds of tonnes have been produced successfully.
The very fine structure offers an intriguing opportunity to explore the fundamental characteristics of bainite that forms at temperatures as low as a quarter of the homologous temperature, where the diffusion distance of atoms on substitutional sites is negligibly small over the time scale of the transformation. A number of revealing experiments have been reported using techniques such as the atom probe and in situ measurements using high–energy X–rays sources [9–13].
The plates of bainite that form at the low temperatures are some 20–40 nm in thickness; their shape deformations have yet to be characterised, and may hold a clue to explain why they are so thin. Optical interference techniques which have been used successfully to look at the surface relief due to coarse plates of martensite cannot be applied even to ordinary bainite because their thickness, typically 0.2μm, is below the wavelength of the light, so that any relief observed is an average due both to the bainite plates and intervening phases such as cementite and austenite. Sandvik resolved this issue by looking at the displacement of austenite twin boundaries by plates of bainitic ferrite using transmission electron microscopy and reported a shear strain associated with an individual plate to be 0.22 [14]. Swallow and Bhadeshia [15] used atomic force microscopy to determine the shear strain to be about 0.26; theory predicts values in the range 0.22–0.28.
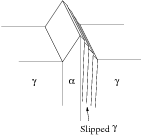
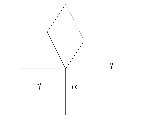
The purpose of the present work was to characterise for the first time, the displacements caused by the formation of nanostructured bainite using the atomic force microscopy technique. It is worth emphasising that the actual shape deformation is strictly an invariant plane strain, which has both a shear (s) and a dilatational component (δ); observed values are summarised for a variety of transformations in steels in Table 1, and the nature of an invariant plane strain illustrated in Fig. 1a,b. There is a further complication with transformations that occur at relatively high temperatures; the shape deformation then is accompanied by plastic relaxation of the adjacent austenite as illustrated in Fig. 1c [15].
| Transformation | s | δ | Morphology | Reference |
| Widmanstätten | 0.36 | 0.03 | Thin Plates | Watson and McDougall [16] |
| Bainite | 0.22 | 0.03 | Thin Plates | Sandvik [17] |
| Bainite | 0.26 | Thin Plates | Swallow and Bhadeshia [15] | |
| Martensite | 0.24 | 0.03 | Thin Plates | Dunne and Wayman [18] |
Samples were machined in the form of square sectioned 4 mm × 4 mm × 30 mm rods, from an alloy of composition Fe-0.79C-1.59Si-1.94Mn-1.33Cr-0.3Mo-0.11V wt%, [1]. They were then metallographically polished on all their surfaces to 1μm, cleaned with high purity ethanol, and sealed in partially evacuated quartz tubes flushed with argon in order to conduct the austenitisation and isothermal transformation heat treatments. All of these measures help reduce contamination and oxidation of the polished surface, but to further reduce surface deterioration, titanium powder was added to the tubes in order to getter any remaining traces of oxygen. Austenitisation was for 15 min at 1473 K (1200∘C) before isothermal transformation at 473 K (200∘C) for 7 days which is sufficient time that the microstructure can be expected to be a mixture of bainite and austenite based on previous results.
A Seiko SPA-300 atomic force microscope was operated in contact mode with a 20μm scanner table and a force reference of 1.95 nN. Images were acquired with 512 × 512 pixel resolution the maximum scan speed used for imaging was 1 Hz and this was reduced in order to prevent artefacts due to excessive ‘jumping’ of the tip caused by scanning over the surface. The voltage sensitivity for the vertical dimension (nm mV-1) was calculated automatically based on the dimensions and resonant frequency of the cantilever which had been supplied by the manufacturer who measured the dimensions of each tip. The quoted accuracy of the frequency is 10%, resulting in 10% error in the measurement of the vertical dimension. Horizontal dimensions were not calibrated; however, it is reasonable to believe that the errors from surface artefacts, and vertical calibration will be much larger than the error in measuring the horizontal dimensions.
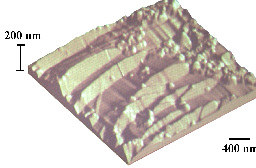
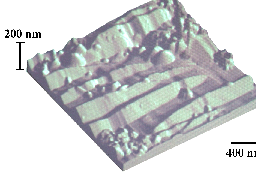
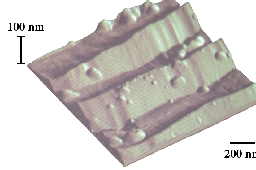
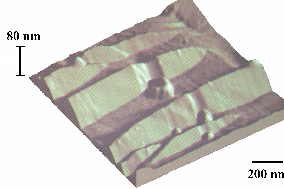
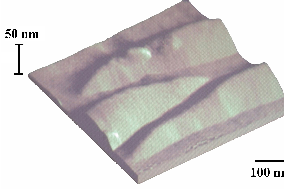
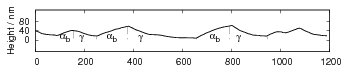
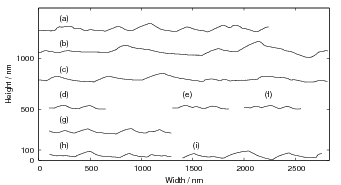
Figs 2 and 3 show the three–dimensional (3D) representations of the areas scanned. As will be seen in the other images the total width of the transformation upheaval of each sub-unit is around 200 nm wide. The shape and distribution is similar to the bainite plates when observed in a transmission electron microscope [1]. Other than the surface relief due to the sub–units, there are some bright, circular patches apparent in the images. These are conical in the three dimensions and are thought to occur due to oxidation or some other contamination of the surface. The samples tended to degrade with time, becoming more oxidised or contaminated, until the sub-units could no longer be seen. Figs 4–5 show the corresponding line scans. The measurements are summarised in Fig. 6.
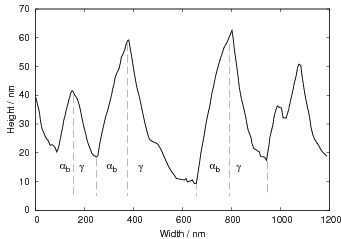
The true shear s due to an individual plate, and indeed, the thickness of the plate, can only be measured directly if the habit plane of the plate is normal to the plane of observation. The plates, however, will in general be inclined to the surface so that the measurement represent an apparent shear component sA which was determined using the gradient of the scan across the plate, sA = height/width. There is a further complication that the austenite adjacent to the bainite plate may relax by plastic deformation [15]. The side corresponding to the bainitic ferrite can be identified from the shape of the lenticular plate in the context of adjacent plates (see Fig. 5, [15]). Furthermore, the angle of shear of adjacent plates should be similar because they should have similar crystallographic orientation within a bainite sheaf. Plastic accommodation in the austenite involves multiple slip systems resulting in intense dislocation tangles [19] and irregular relief.
It should be noted that in the experiments reported here, the observation plane and specimen surface were both horizontal. Because of the different magnifications of the vertical and horizontal scale, simply looking at the 3D representations and the topographic line scans can give an exaggerated view of the magnitude of the features, as demonstrated by comparing Figs 3 (a) and (b). If the shear component is around 0.25–0.28 the features expected due to shearing should be 3.5-4 times wider than they are high, it may be more useful to interpretation of the data to plot the data with a 1:1 ratio between the scales of height and horizontal displacement, as demonstrated in Fig. 4 and 5.
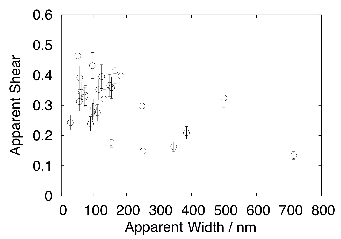
The result of measuring the apparent shear is shown in Fig. 6. The maximum is about 0.46, significantly larger than the 0.28 based on the values previously calculated from the phenomenological theory of martensite crystallography [15], and larger than the published experimental observation of 0.26 [15]. The maximum value should be expected when the plate major axis is perpendicular to the surface. It is possible that the fine scale of the structure resulting from transformation at 473 K (200∘C) results in a larger error, in which case the measurements should exhibit significantly larger scatter about the mean which was not observed. If h and w are the measured values of height and width of a plate on the plane of observation, the apparent shear is simply given by,
|
| (1) |
Suppose the plate intersects the free surface with an angle θ, if we re–orientate the plate onto the surface then the true plate width wt, height ht and shear are given by,
 | (2) |
Plotting the observed values against the plate width shows the tendency implied by these equations in Fig. 6. If all the plates are of equal true–thickness, then the plates which are seen as wide in their two–dimensional projections on the plane of observation have relatively shallow inclination to that plane and hence a smaller apparent shear. This is precisely the trend observed in Fig. 6, however a corrected shear could not be reliably calculated, presumably because there is also a spread in the true plate widths. For this reason the largest shears measured have to be used to as the best indication as to the value of the shear component.
It is emphasised that these calculations assume that each plate measured makes a substantial intersection with the free surface. The plates have a lenticular morphology [20, 21] so if only the periphery of a deeply located plate intersects the free surface then the apparent width will be smaller. This, together with the fact that the orientation of the displacement vector of the shape deformation can vary relative to the free surface, could explain why different values of apparent shear are observed for the same apparent width in Fig. 6. Neither of these observations detract from the fact that the maximum observed value of the shear will be closer to the actual shear.
The results are interesting in that the true shear estimated for the nanostructured bainite is likely to be about 0.46, which is much larger than has been observed for ordinary bainite at about 0.26 [15]. It was stated previously that the crystallographic theory when applied to bainite leads to shear strains in the range 0.22–0.26. However, these values depend on the magnitude and choice of the system on which lattice invariant deformation occurs. Shear strains as large as 0.46 have indeed been reported in the past for Widmanstätten ferrite [16] and explained in this manner. But the most important observations is that the large shear strain observed here is consistent with the very fine 20–40 nm true thickness of the ferrite plates because the strain energy per unit volume E scales with the aspect ratio of the plates:
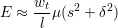 | (3) |
where l is the plate length, taken as a conservative 1μm and μ is the shear modulus of the austenite. Taking δ ≈ 0.03, wt ≈ 30nm, s ≈ 0.46 this gives ≈ 340J mol-1 which compares with the 400 J mol-1 associated with normal bainite [22].
A value of ≈ 0.46 was determined for the shear component of the displacements due to individual plates of bainitic ferrite transformed at 473 K (200∘C). This is larger than previously reported using the same experimental technique but for bainite generated by transformation at a higher temperature. The large shear is consistent with the slender character of the bainitic ferrite plates that form at low homologous temperatures, and is not unprecedented in the context of solid–state phase transformations in steels [16]. It is speculated that different modes of lattice invariant deformation might operate when the transformation occurs in the austenite that is strengthened by the large carbon concentration of the alloy studied, and the lower temperature at which transformation was induced.
The authors are grateful to the Engineering and Physical Sciences Research Council, and to Corus plc. (now Tata Steel) for their support of this work.
[1] F. G. Caballero, H. K. D. H. Bhadeshia, K. J. A. Mawella, D. G. Jones, and P. Brown. Very strong, low–temperature bainite. Materials Science and Technology, 18:279–284, 2002.
[2] F. G. Caballero and H. K. D. H. Bhadeshia. Very strong bainite. Current Opinion in Solid State and Materials Science, 8:251–257, 2004.
[3] C. G. Mateo and F. G. Caballero. Ultrahigh–strength bainitic steels. ISIJ International, 45:1736–1740, 2005.
[4] H. K. D. H. Bhadeshia. Nanostructured bainite. Proceedings of the Royal Society of London A, 466:3–18, 2010.
[5] F. Hu and K. Wu. Isothermal transformation of low temperature super bainite. Advanced Materials Research, 146–147:1843–1848, 2100.
[6] H. K. D. H. Bhadeshia and D. V. Edmonds. Bainite in silicon steels: a new composition property approach i. Metal Science, 17:411–419, 1983.
[7] H. K. D. H. Bhadeshia and D. V. Edmonds. Bainite in silicon steels: a new composition property approach ii. Metal Science, 17:420–425, 1983.
[8] Patent number GB2462197. Bainite steel and methods of manufacture thereof. Intellectual Property Office, London, 2010.
[9] M. Peet, S. S. Babu, M. K. Miller, and H. K. D. H. Bhadeshia. Three–dimensional atom probe analysis of carbon distribution in low–temperature bainite. Scripta Materialia, 50:1277–1281, 2004.
[10] S. S. Babu, E. D. Specht, S. A. David, E. Karapetrova, P. Zschack, M. Peet, and H. K. D. H. Bhadeshia. In-situ observations of lattice parameter fluctuations in austenite and transformation to bainite. Metallurgical & Materials Transactions A, 36A:3281–3289, 2005.
[11] H. J. Stone, M. J. Peet, H. K. D. H. Bhadeshia, P. J. Withers, S. S. Babu, and E. D. Specht. Synchrotron X-ray studies of austenite and bainitic ferrite. Proceedings of the Royal Society A, 464:1009–1027, 2008.
[12] M. Peet, C. Garcia-Mateo, F. G. Caballero, and H. K. D. H. Bhadeshia. Tempering of a hard mixture of bainitic ferrite and austenite. Materials Science and Technology, 20:814–818, 2004.
[13] F. G. Caballero, M. K. Miller, A. J. Clarke, and C. Garcia-Mateo. Examination of carbon partitioning into austenite during tempering of bainite. Acta Materialia, 63:442–445, 2010.
[14] B. P. J. Sandvik and H. P. Nevalainen. Structure-property relationships in commercial low-alloy bainitic-austenitic steel with high strength, ductility, and toughness. Metals Technology, 8:213–220, 1981.
[15] E. Swallow and H. K. D. H. Bhadeshia. High resolution observations of displacements caused by bainitic transformation. Materials Science and Technology, 12:121–125, 1996.
[16] J. D. Watson and P. G. McDougall. The crystallography of Widmanstätten ferrite. Acta Metallurgica, 21:961–973, 1973.
[17] B. J. P. Sandvik. The bainite reaction in Fe-Si-C alloys: the primary stage. Metallurgical Transactions, 13A:777–787, 1982.
[18] D. P. Dunne and C. M. Wayman. The crystallography of ferrous martensite. Metallurgical Transactions, 2:2327–2341, 1971.
[19] H. K. D. H. Bhadeshia and D. V. Edmonds. The bainite transformation in a silicon steel. Metallurgical Transactions A, 10A:895–907, 1979.
[20] G. R. Srinivasan and C. M. Wayman. Isothermal transformation in an fe-7.9cr-1.1c alloy. Trans. Met. Soc. AIME, 242:78–81, 1968.
[21] H. K. D. H. Bhadeshia and D. V. Edmonds. The mechanism of bainite formation in steels. Acta Metallurgica, 28:1265–1273, 1980.
[22] H. K. D. H. Bhadeshia. Rationalisation of shear transformations in steels. Acta Metallurgica, 29:1117–1130, 1981.
| ( |

| ( |
| ( |