Fatigue of Extremely Fine Bainite
M. J. Peet, P. Hill*, M. Rawson*, S. Wood* and H. K. D. H. Bhadeshia
University of Cambridge
Materials Science and Metallurgy, Cambridge CB2 3QZ, U. K.
*Rolls–Royce plc., Derby, U.K.
Abstract
There is a novel steel invented in which the structure consists of extremely fine platelets of bainitic
ferrite dispersed in a matrix of carbon–enriched retained austenite. The resulting large density
of interfaces makes the alloy very strong in its transformed condition. We report the first
fatigue tests on this system, by measuring the life of parallel gauged samples tested using cyclic
loading in tension, with maximum stresses in the range 1.2–1.6 GPa. A comparison of the
results against published data indicates that the performance of the steel is consistent with the
behaviour of other strong steels, in spite of the fact that it is produced using an air–melting
technique.
Introduction
It is now possible to routinely and cheaply generate a very high density of interfaces in steel, resulting in
strength which can be controlled in the range 1.6–2.5 GPa with a hardness of about 650–700 HV
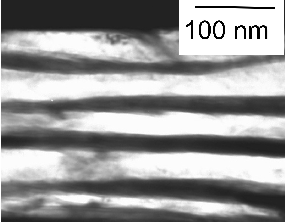
depending on the transformation conditions. The structure, which is obtained by the solid–state
transformation of austenite at low homologous temperatures (180–250∘C), consists of plates of bainitic
ferrite which are just 20–40 nm in thickness, dispersed in a residue of carbon–enriched retained austenite,
Fig. 1 [1, 2].
There is an interest in developing these steels for the manufacture of shafts which have a high
surface integrity, but which are subjected during rotation to alternating stresses, making the
fatigue performance of the material an important design parameter. The purpose of the present
work was to determine for the first time, the fatigue behaviour of a nanostructured steel.
Method
There are many variants of the alloy system that have been shown capable of producing the bainite
described above; the one which is the focus of the present work contains a modest addition of cobalt in
order to accelerate the transformation, since cobalt increases the free energy difference between austenite
and ferrite [3, 4]. The material used was produced as a 25 kg experimental air–melt supplied by Corus,
rolled to approximately 45 mm thick plate. A block 40×50×100 mm was homogenised in a vacuum furnace
at 1200∘C for two days, followed by furnace cooling to room temperature. The chemical composition of
the alloy is
 The
structure and tensile properties of this alloy have been characterised previously. Austenitisation for 30 min
at 900∘C followed by isothermal transformation at 200∘C for 9 days yields a bainitic–ferrite volume
fraction of 0.79 and a bainite plate thickness of 38±2 nm resulting in a hardness of 690 HV [5, 6]. The
proof and tensile strengths reported were 1.45 GPa and 2.2 GPa respectively, with an elongation of 5% and
a fracture toughness of 28 MPa
The
structure and tensile properties of this alloy have been characterised previously. Austenitisation for 30 min
at 900∘C followed by isothermal transformation at 200∘C for 9 days yields a bainitic–ferrite volume
fraction of 0.79 and a bainite plate thickness of 38±2 nm resulting in a hardness of 690 HV [5, 6]. The
proof and tensile strengths reported were 1.45 GPa and 2.2 GPa respectively, with an elongation of 5% and
a fracture toughness of 28 MPa . In separate work [7] where the transformation period at 200∘
C was
three days, the 0.2% proof strength achieved was 1.19 GPa, an ultimate tensile strength of 2.18 GPa, and
elongation of 4.6 %.
. In separate work [7] where the transformation period at 200∘
C was
three days, the 0.2% proof strength achieved was 1.19 GPa, an ultimate tensile strength of 2.18 GPa, and
elongation of 4.6 %.
Cylinders 10 mm in diameter, machined from the homogenised steel, were placed in a furnace at 500∘C;
the furnace was purged with argon throughout the heat treatment. The temperature was then raised to
900∘C over a period of 30 min, held at that temperature for 15 min, after which the samples were
transferred into an oven at 200∘C±0.1 for 10 days to generate the fine bainite with a hardness of 680±3
HV50. After heat treatment, the blanks were machined into push–pull type fatigue samples with the final
dimensions: 4.5 mm diameter, 12 mm gauge length, and a 9 mm radius leading on to the grips which
had 20 UNF threads. Such samples expose a greater volume of material to tensile stress than
rotating–bend specimens, and hence are better able to discover the role of inclusions. The gauge
length was polished to give a 0.25 μm finish. The gauge length was masked and the threads of
the samples were shot–peened using glass beads in order to prevent failure in the specimen
grips.
Fatigue testing was conducted on an Instron 8800 testing machine, controlled by Instron LCF v7.2 Fast
Track2 software. The loading was at a 0.25 Hz, with each 4 s cycle consisting of four steps, each of 1 s
duration: a hold at the minimum tensile stress, followed by a linear ramp to the maximum
stress, hold at that stress and a ramp down to the minimum stress. This is often said to be a
trapezoidal 1-1-1-1 s profile. The ratio of the minimum to maximum stress was maintained at
R = 0.1.
Results
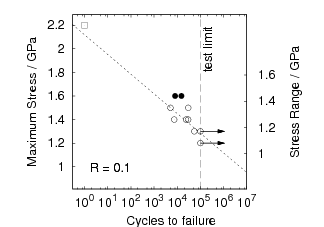
Fig. 2 summarises the outcomes and compares against the previously reported tensile strength [5, 6];
the 0.2% proof strength and elongation were reported as 1.45 MPa and 4.6% respectively.
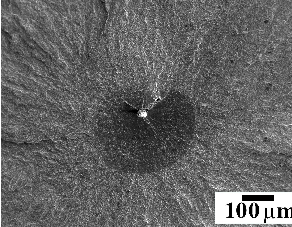
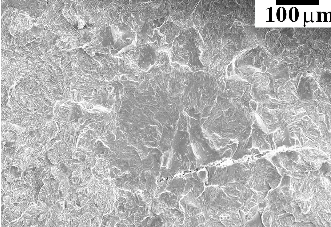
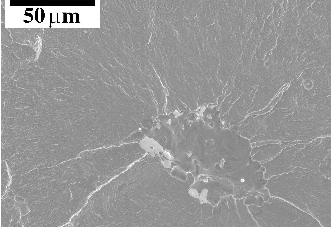
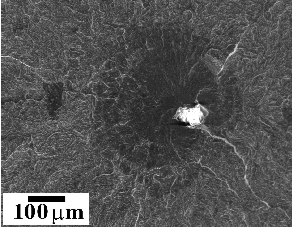
Fractography revealed that failure initiated from inclusions except for samples tested at the highest of
stresses, where cracks apparently began from the polished surface. The origins of fracture can be seen in
Figs 3 to 7, and the complete set of results is summarised in Table 1. The inclusions were identified using
energy dispersive X–ray analysis as oxides, high in aluminium or magnesium; calcium sulphide was also
observed.
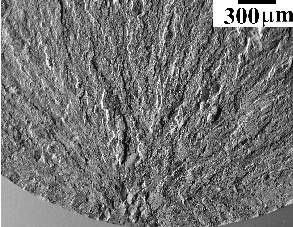
Classic ‘white area’ or ‘fish eye’ fracture patterns characteristic of fatigue fracture [8] can be seen in
samples tested at maximum stresses (σmax) of 1.3 and 1.4 GPa in Figs 3 and 6. For the samples tested at
σmax =1.5 and 1.6 GPa, the fracture surfaces appeared much more brittle, making it very difficult to
discern any area of fatigue crack growth.
The results are summarised as a S-N curve in Fig. 2. Regression analysis of the data, excluding the
samples tested again at the greatest stress (i.e., excluding the filled circles in Fig. 2), permitted the
estimation of the fatigue life as defined for our purposes to be the maximum cyclic stress for which the
samples must survive 107cycles – this stress was found to be σmax =855 MPa which may represent a
conservative estimate given that two of the samples survived 105 cycles at 1.2 and 1.3 GPa without
failure.
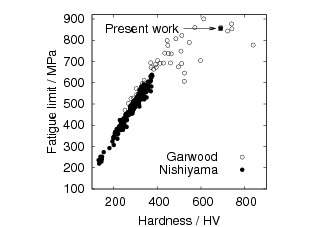
A strong correlation has been observed between the fatigue limit and the hardness over a range of steels
and microstructures [9, 10], Fig. 8. The linear trend in their results breaks down at high hardness values,
with a maximum fatigue limit of 900 MPa at hardness of about 600 HV. The linear relation between the
fatigue limit and hardness has also been shown for values below 400 HV, independent of microstructure or
steel type [11]. This might be expected given that the resistance to plastic deformation, as measured by
hardness indentations, determines also the resistance to the plasticity required to initiate and propagate
fatigue [11]. Fatigue data analysed by Murakami [12] led to the proposal of a ‘defect–free
fatigue limit’ σw0 which can be calculated from the tensile strength (σU) or the hardness
(HV):
 | (1) |
This relationship has been shown to work well for hardness values below about 400 HV, independent of
microstructure and even for aluminium alloys. However, L’vov et al. [13] studied a steel which contained
metastable austenite and concluded that the microstructure did have an influence, both through the
austenite substructure resulting from warm deformation during processing, and by transformation to
martensite during loading. It is possible that both of these would be reflected in increased ultimate tensile
strength and hardness.
Fig. 8 shows that the present steel, consisting of fine bainite and retained austenite, has a high fatigue
limit which compares well with the other data [9, 10]. On the basis of equation 1, the present alloy should
have a ‘defect free’ fatigue limit of σw0 = 1.1 GPa.
Given that the fatigue limit correlates with the hardness which is a coarse measure of properties, it is not
possible from the present work to isolate the specific influence of retained austenite. Wenyan et al. [14]
studied carbide–free bainitic steel samples containing retained austenite fractions 0.08 to 0.23, and found
that the threshold stress-intensity increased and the crack propagation rate decreased, as the fraction of
retained austenite was increased. This is in spite of the fact that the samples with less austenite were
stronger. In general the opposite effect is expected since the crack growth increment per cycle
should be inversely proportional to the cyclic yield strength because the crack tip opening
displacement will be smaller when the yield strength is large. This reinforces the conclusion [14]
that the austenite is beneficial to fatigue performance. Although the detailed mechanism is
not understood, it is possible that the stress or strain–induced transformation of austenite is
responsible for the improved properties [15]. On the other hand, a high strain hardening rate
accompanying the transformation of austenite may be detrimental if this reduces the ability of the
material to accommodate plastic strain [16, 17]. The role of austenite therefore deserves further
study.
The level of cleanliness with respect to non–metallic inclusions has naturally been correlated against
fatigue performance by many researchers. But the problem is difficult since the occurrence of infrequent
and large inclusions depends also on the volume sampled by the stress. Inclusions in general may be
regarded as stress concentrations through a variety of mechanisms including the loss of coherence with the
matrix and when the particle itself fractures and introduces a sharp crack. The inclusion size,
approximate shape and position within the sample are recorded in Table 1. It has been proposed
[18, 19] that the fatigue limit σL is related to the hardness, and effective area of the inclusion as
follows;
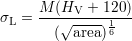 | (2) |
where M is a constant depending on the position of a crack, non–metallic inclusion or defect, and is set
equal to 1.43 for surface defects, 1.41 for sub–surface defects which touch the surface, and 1.56 for internal
defects. The fatigue limit estimated in this way for each sample, based on the observed size of the
inclusion, is appended to Table 1. There is some consistency in that the sample with the lowest life during
testing with σmax = 1.4 GPa, also has the lowest calculated σL. Based on equation 2, the
expected fatigue limit is 600–700 MPa depending on the inclusions sizes observed. Given that
the fatigue limit obtained by extrapolating the data in Fig. 2 is 855 MPa, it is speculated
that the steel is more tolerant to inclusions, possibly because of the presence of the retained
austenite which would tend to relieve stress concentrations via transformation induced plasticity
[20].
Conclusions
A nanostructured steel containing slender plates of bainitic ferrite in a matrix of high–carbon retained
austenite has been studied under fatigue loading using tensile specimens in order to uniformly stress a
significant volume of material. The tests were performed at high stresses whose maximum values were
between 1.2–1.6 GPa. The performance of the steel is generally consistent with published work on iron
alloys of similar hardness. A fatigue limit of about 855 MPa is estimated assuming no failure in 107 cycles,
based on extrapolation of data in which the maximum number of cycles permitted was 105. Samples
tested at lower loads survived 105 cycles which possibly makes the extrapolation a conservative estimate of
the fatigue limit.
As is well known, the fatigue life depends upon the cleanliness of the steel, which in the present work was
made as an air melt. It is assumed therefore that the fatigue performance of the nanostructured steel
should be better when it is manufactured using clean steelmaking technologies.
Acknowledgments
The authors are grateful Rolls–Royce plc. for funding this research and to Professor Lindsay Greer for the
provision of laboratory facilities at the University of Cambridge.
References
[1] F. G. Caballero, H. K. D. H. Bhadeshia, K. J. A. Mawella, D. G. Jones, and P. Brown.
Very strong, low–temperature bainite. Materials Science and Technology, 18:279–284, 2002.
[2] F. G. Caballero and H. K. D. H. Bhadeshia. Very strong bainite. Current Opinion in
Solid State and Materials Science, 8:251–257, 2004.
[3] H. I. Aaronson, H. A. Domian, and G. M. Pound. Partitioning of alloying elements
between austenite and proeutectoid ferrite and bainite. TMS–AIME, 236:781–796, 1966.
[4] C. Garcia-Mateo, F. G. Caballero, and H. K. D. H. Bhadeshia. Acceleration of
low–temperature bainite. ISIJ International, 43:1821–1825, 2003.
[5] C. Garcia-Mateo and F. G. Caballero. Role of retained austenite on tensile properties of
steels with bainitic microstructures. Materials Transactions, 46:1839–1846, 2005.
[6] C. Garcia-Mateo, F. G. Caballero, and H. K. D. H. Bhadeshia. Mechanical properties of
low–temperature bainite. Materials Science Forum, 500–501:495–502, 2005.
[7] M. Y. Sherif. Characterisation and development of nanostructured, ultrahigh strength, and
ductile bainitic steels. University of Cambridge, 2005.
[8] P. H. Frith. Fatigue tests on rolled alloy steels mad in electric and open–hearth furnaces.
J. Iron Steel Inst., 180:26–33, 1955.
[9] M. F. Garwood, H. H. Zurburg, and M. A. Erickson. Correlation of Laboratory Tests and
Service Performance, chapter Interpretation of Tests and Correlation with Service, pages 1–77.
ASM, 1951.
[10] S. Nishiyama. Statistical analysis of fatigue test data. Journal of the Society of Materials
Science, Japan, 29:24–29, 1980.
[11] G. Chalant and B. M. Suyitno. Effects of microstructure on low and high cycle fatigue
behaviour of a micro-alloyed steel. In M. Jono and T. Inoue, editors, Proceedings of the
6th International Conference on Mechical Behaviour of Materials, volume VI, pages 511–516,
Kyoto, Japan, 1991. Pergamon Press, Oxford, Elsevier Science.
[12] Y. Murakami. Metal Fatigue: Effects of Small Defects and Nonmetallic Inclusions. Elsevier
Science, Oxford, U. K., 2002.
[13] Yu. B. L’vov, A. Ya. Maloletnev, M. D. Perkas, Yu. G. Birakhovskii, N. K. Leonova, and
Ya. B. Gurevich. Features of the fatigue failure of steel with metastable austenite. Metal
Science and Heat Treatment, 22:868–870, 1980.
[14] L. Wenyan, Q. Jingxin, and S. Hesheng. Fatigue crack growth behaviour of a Si-Mn steel
with carbide-free lathy bainite. Journal of Material Science, 32:427–430, 1997.
[15] G. R. Chanani, S. D. Antolovich, and W. W. Gerberich. Fatigue crack propagation in
TRIP steels. Metallurgical Transactions, 3:2661–2672, 1972.
[16] B. Cotterell. An interpretation of the mechanics of crack growth by fatigue. Trans. ASME,
87:230–236, 1965.
[17] Z. Khan and M. Ahmed. Stress-induced martensitic transformation in metastable
austenitic stainless steels: Effect on fatigue crack growth rate. Journal of Materials Engineering
and Performance, 5:201–208, 1996.
[18] Y. Murakami, S. Kodama, and S. Konuma. Quantitative equation of effects of
non-metallic inclusions on fatigue strength of metals. Transactions of the Japan Society of
Mechanical Engineers A, 54:688–696, 1988.
[19] Y. Murakami and H. Usuki. Prediction on fatigue strength of high–strength steels based
on statistical evaluation of inclusion size. Transactions of the Japan Society of Mechanical
Engineers A, 55:213–221, 1989.
[20] W. W. Gerberich, G. Thomas, E. R. Parker, and V. F. Zackay. Metastable austenites:
decomposition and strength. In Second International Conference on Strength of Metals and
Alloys, pages 894–899, Ohio, USA, 1970. ASM International.
[21] H. Qvarnström. Technical note: A mathematical formula for transformation between the
steel hardness scales of Rockwell C and Vickers. Journal of Heat Treatment, 7:65–67, 1989.
Table 1: Fatigue test data, loading in tension with R = 0.1, trapezoidal loading profile (1-1-1-1)
with 0.25 Hz. σmax represents the maximum stress, d the depth at which an initiating inclusion is
found below the sample surface, and σL the estimated fatigue limit. ‘GL’ stands for gauge length.
| σmax / GPa | Cycles | Identification | Inclusion | d / μm | Inclusion Size | Fatigue zone size | σL / MPa |
| | | | | | | | |
| 1.2 | >105 | F1 | - | - | - | - | - |
| | | | | | | | |
| 1.3 | >105 | F2 | - | - | - | - | - |
| | | | | | | | |
| 1.3 | 52,460 | F3, Fig. 3 | O, Al, Cr | 1400 | 30-40μm diameter
sphere, secondary inclusion is
string 200 × 20 μm | 220μm diameter disk | 710 |
| | | | | | | | |
| 1.4 | 7,400 | F4, Fig. 4 | Al, Mg, O, CaS | 1070 | 300μm long cluster/string | 300μm diamater disk | 612 |
| | | | | | | | |
| 1.4 | 29,627 | F5, Fig. 5 | Al,0 | 110 | Cluster of inclusions 10-20μm,
string of particles 60μm in
length | 60 × 80μm square | 699 |
| | | | | | | | |
| 1.4 | 23,932 | F6 Fig. 6 | MgO | 1125 | 50μm sphere | 275-400μm, concentric
rings, final of which is
400μm | 673 |
| 1.5 | 5,088 | F7 Fig. 7 | | | Initiated at surface, with
brittle/granular fracture | | |
| | | | | | | | |
| 1.5 | 29,817 | F8 | Mg, Al, O, Ca, S | 80 | Initiated close to surface,
flat appearance/possibly by
fatigue | 30-50μm surface
hemisphere | |
| | | | | | | | |
| 1.6 | 15,131 | F9 | | 0 | Initiated at surface, with
brittle/granular fracture | - | |
| | | | | | | | |
| 1.6 | 8,047 | F10 | | 0 | Non–GL failure
(threads), complex fracture
surface, multiple possible
initiation points at surface. | - | |
| | | | | | | | |
| |