Chaos
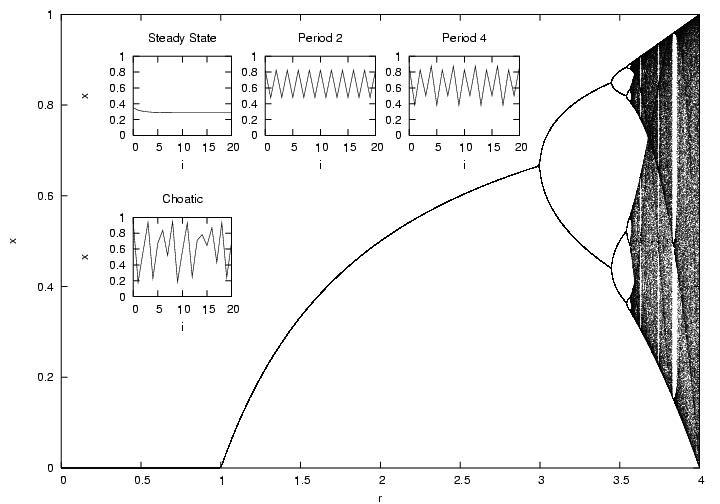
Simple non linear equations can produce choatic behaviour. Take this example (from James Gleick's 'Chaos', Penguin Books, 1987, pages 59-80), the equation Xnext = rx(1-x) is used to model the change in a population from year to year, where x is the population scaled from 0 to 1, r is a parameter, which changes the magnitude of fluctuations in the population.
When r is low, the population becomes extinct, as the parameter rises the equilibrium level of the population rises, however at a critical point the equilibrium splits in two, with the population fluctuating between two values. Increase the value a little more and the population now repeats the same pattern every 4 years. The bifurcations become faster, 4, 8, 16, 32...etc, before reaching a point of accumulation where the periodicity gives way to choatic behaviour.
This is not the whole story, raise the paramater again and suddenly a window appears with a regular period, 3 or 7, the period doubling bifurcations appear again, and then choas. These windows of order resemble the whole diagram, the structure is infinitely deep.
Bifurcation diagram
chaos-0.01.tar - tar files of very simple C program to generate data for graph above.
chaos.gnu - gnuplot template I used to generate the above graph.
To generate the graph, first compile the c program, then pipe the output to a file called out, then use gnuplot to generate a postscript file. On a unix like operating system, type something like this:
tar -xf chaos-0.01.tar
gcc chaos-0.01.c -o chaos
chaos > out
gnuplot chaos.gnu
Running the script in gnuplot will generated a postscript file 'chaos-plot.eps'.
Warning - with the current values in the choas program, the files will be big, it may take minutes to generate and view the postscript file, you might want to experiment with the values you use.
A quick search of the web might lead you to: Chaos hypertextbook.com.