Gnuplot Tutorial
Part 3 - Further information on plotting data
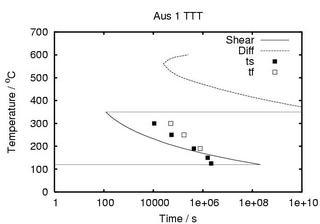
Example gnuplot scripts to generate TTT diagram below, look here This graph is plotted from the tabulated output of the MAP program mucg73. By using conditional statements the curves for shear and displacive transformation can be plotted between the relevant temperatures only.
To generate the graph above copy the example data file in the directory, also download the script. This script is used in a differnt way, by passing the name script to gnuplot on the command line, it won't work if you try is in the way above. The script i have written can be used for plotting other TTT diagram data from mucg73 only if you understand how to alter the Ms and Bs temperatures. If you are interested in using mucg73 to produce similar graphs, i recommend changing the temperature step size to 1 degree. Aplogies to those who find this too specific an example!
To use the script and see the results, type at the command line:
[00:00:01]{comp:user}>gnuplot plot_mucg.gnu > out.ps
[00:00:01]{comp:user}>gv out.ps
Without the '>' the output would be to the command line, and you would see the postscipt commands in your terminal. '>' redirects output from stdout to the file out.ps. It would also be possible to specify the filename in the script using the command 'set output "file.ps"'. It might be useful to explain the plot command used to generate the graph above, its the most complicated we've seen in the tutorial.
#plots data from mucg73 predictions, and also experimental data
plot 'aus1-mucg-m' using 15:($4<360 && $4>110 ? $4 : 1/0) title "Shear" w l ls 1, \
'aus1-mucg-m' using 16:($4>325 ? $4 : 1/0) title "Diff" w l ls 2, \
'experimental' using 2:1 title "ts" ls 3, 'experimental' using 3:1 title "tf" ls 4
The first line is simply a comment to explain what's going on here, the '\' character at the end of the line indicates that the command continues on the next line - i've simply used it here to demonstate how to do that, it isn't usually necessary but often makes things simpler to read. The first line of the plot command says we want to plot the 15th column against the 4th column, of file 'aus1-mucg-m' but only in the range 110-360, and we want to use the title shear, and sets some formats for the line. The second line of the plot command plots the 16th column against the 4th, but only for values above 325, the 3rd line plots some data points without a line from the file 'experimental'.