Gnuplot Tutorial
Part 1 - The basics
First make sure gnuplot is available on your system - it is usually available in most linux distributions, or you can obtain the source code download (note gnuplot is not written by Gnu and is not totally free from copyright restrictions). However you should still be able to find a version for your system for 'free'
1. Starting Gnuplot
If you are using unix/linux open a terminal (e.g. xterm) and type gnuplot. If you are in the graphical environment then you will be able to output graphs from gnuplot directly to the screen (Note the example below tells us the terminal type is x11).
[00:00:00]{comp:user}$gnuplot

   G N U P L O T
   Version 3.7 patchlevel 2
   last modified Sat Jan 19 15:23:37 GMT 2002
   System: Linux 2.4.18-14smp

   Copyright(C) 1986 - 1993, 1998 - 2002
   Thomas Williams, Colin Kelley and many others

   Type `help` to access the on-line reference manual
   The gnuplot FAQ is available from
   http://www.gnuplot.info/gnuplot-faq.html

   Send comments and requests for help to <info-gnuplot@dartmouth.edu>

   Send bugs, suggestions and mods to <bug-gnuplot@dartmouth.edu>


Terminal type set to 'x11'
gnuplot>
2. Plotting a function
We can now plot a function using the 'plot' command. After you type the command as below, try with your favourite functions.
gnuplot> plot sin(x)
This should plot the graph of sin(x) to the screen, it is also possible to output to many different types of terminal using the term command.

Link to image generated in first example
3. Adjusting the graph format
Next we want to set a title for the graph.
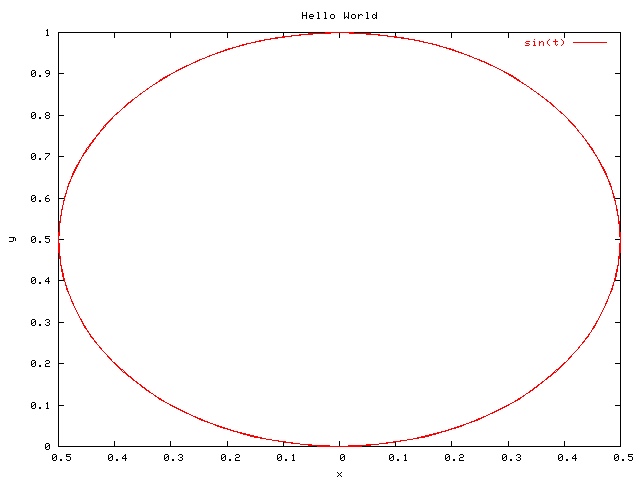
gnuplot> set title "Hello World"
gnuplot> replot
Also we want to make the graph use polar coordinates, here the 'dummy' variable is 't' rather than 'x' so we type;
gnuplot> set polar
gnuplot> plot sin(t)
And it wouldn't be a proper graph without labelling the x and y axes;
gnuplot> set xlabel "x"
gnuplot> set ylabel "y"
gnuplot> replot
Output to a file
By selecting a different terminal type, it is possible to output to a large number of graphic formats, you can get a full list by typing 'set term', lets ouput this graph using the png terminal (Portable network graphics).
gnuplot> set terminal png
Terminal type set to 'png'
Options are ' small color'
This tells us that we set the terminal type to png with the default options small and color. 'set term' gives a list of the different options for each terminal type.
We need to supply a filename for the output, this is done using the command 'set out <filename>', then simply replot the graph and voila!
gnuplot> set output 'sin_graph.png'
Link to see output file sin_graph.png
Saving settings
Now we might be happy to have generated this graph, but imagine we find a mistake later, it might be useful to get back to this point without having to retype everything into gnuplot. We can save and load settings fortunately.
gnuplot> save set "settings.gnu"
gnuplot> exit
Now we can return to gnuplot, and get the same settings, in this case we are only spared from a little of the typing we did originally:
[00:00:01]{comp:user}$gnuplot

   G N U P L O T
   Version 3.7 patchlevel 2
   last modified Sat Jan 19 15:23:37 GMT 2002
   System: Linux 2.4.18-14smp

   Copyright(C) 1986 - 1993, 1998 - 2002
   Thomas Williams, Colin Kelley and many others

   Type `help` to access the on-line reference manual
   The gnuplot FAQ is available from
   http://www.gnuplot.info/gnuplot-faq.html

   Send comments and requests for help to <info-gnuplot@dartmouth.edu>

   Send bugs, suggestions and mods to <bug-gnuplot@dartmouth.edu>


Terminal type set to 'x11'
gnuplot> load "settings.gnu"
gnuplot> set terminal png
gnuplot> set output "sin_graph2.png"
gnuplot> plot sin(t)
Homework
Well that's it for this part of the tutorial, you might like to try looking at the gnuplot manual, atleast make sure you have acess to copy for reference if you are going to be using gnuplot (it's available in html, postscipt, etc), also take a look at the links on the page above, especially if you are interested in plotting functions, which can also be done in 3 dimensions using splot command. Also you might want to just play around with gnuplot, and try the interative help, maybe have a look at the settings file you generated.
Now that we have introduced the basics of gnuplot, the next two tutorials will focus on plotting data. On to part 2!